Showing posts with label reports. Show all posts

Friday, 24 February 2012

Using Calculated Fields in Queries

Queries play an important part (in relational database design) in pulling information from different tables together. Consider the Many to Many relationship at the centre of an Order Management System.  Here we have three tables - Orders, Order Details and Products.  When we come to create the record source for the order items section of the invoice report,  it is necessary to get data regarding an order items quantity from the Order Details table, and that of product cost per unit from the Products Table. Then it is the OrderId from the Orders Table which groups all Order Details records into a single order.

Figure 1 (above):  A simplified example of a Many to Many Relationship from an Order Management Database.


Figure 2: A sample Invoice Report taken from one of my Order Management Database designs.
The Order Items Section is located in the middle of the report.  CostPerUnit is
displayed here as Unit Cost and Amount as Total.  This  section contains
details of each individual order item which, taken together,
makes up the whole order.
As well as bringing information together in this way, query's play another important role in as much as they are commonly used to calculate and process information from these tables.  This may be done by means of a Calculated Field.  This is basically a new query column, the values of which being derived from some calculation or expression.  As such, we are effectively creating new data for our database.  So why is this important?  Well, consider the Order Management Database Invoice mentioned earlier.  As already stated, the Order Details table contains data pertaining to an order items quantity, and the Products table to an items Cost Per Unit.  There is nowhere in a well designed ('normalised') database where we store the total of quantity*cost per unit. It is considered good practice to calculate this information (so we avoid storing unnecessary data which uses extra memory, and makes the database less efficient and user friendly).  The Calculated Field used in a query is a common way of doing this.

Creating a calculated field is really quite easy.  Rather selecting a table field on the top row of the query design grid, we manually type the name (or alias), followed by a colon, then followed by the calculation or expression.  So if we wanted to create a calculated field to process quantity * cost per unit, we would use this syntax:

Amount: [Quantity]*[CostPerUnit]

I should point out that the alias used here - ie Amount - is entirely arbitrary text chosen by the database developer. It is, however, good practice to make it something meaningful in order to make it easier for the developer to understand at a later point in time.

Let look at how this fits in with the rest of the query:

Figure 3: Query with Calculated Field on the right.

As you can see the query contains a mixture of fields from all three tables involved in the many to many relationship.  The Calculated Field has been added to the column on the right.  You may have noticed that the calculated field looks slightly more complicated than the syntax I wrote earlier in the post.  This is because we are also specifying the table name as well as the field name.  As such:

[tblOrderDetails].[Quantity] 

... refers to the Quantity field of tblOrderDetails, and:

 [tblProducts].[CostPerUnit] 

... refers to the CostPerUnit field of tblProducts.

It is essential to write the full reference in this way if any tables or sub-queries involved in the query contain duplicated field names.  Although this is not the case in this example, it does no harm to get into the habit of writing the full syntax anyway.

And this is the output from the query showing the result of the calculated field on the right:

Figure 4: The Query Output.
Since this query has an ID field corresponding to tblOrder.OrderId, it can now be used as the record source for the Order Items section of an Invoice Report or Orders Subform.  To do this the LINK MASTER FIELDS property of the subform is set to ID and the LINK CHILD FIELDS is set to OrderId.  There is then the matter of creating the record source for the main section of the invoice report or orders form (this also involves creating Calculated Fields to get the Order Totals).  Unfortunately this goes beyond the scope of this particular post.

Friday, 13 January 2012

Using VBA to Filter Report Results

Earlier this week I was asked how to filter the results of a report using a criteria selected from three Combo Boxes on a search form.  You can see Marwa's question posted on my Access Tutorial Facebook Page (Tuesday 10th January 2012).  The solution I suggested involved creating a Parameter Query with three separate criteria referencing the values contained in the Combo Boxes on the Search Form.  You can see the full response I gave in my comment below her question.

By co-incidence I have also been working on a similar task in my work as an Access Developer.  One of the projects I am currently working on is a Journal Database which uses descriptive tags to categorise journal entries.   So, for example, if users made an entry about their progress learning Microsoft Access, they might use tags such as  "Database Development", "Reports", and "Filters" to categorise their entry.

I wanted to create an quick way for users to search their journal by tag name, so that all records categorised by a given tag may be extracted and displayed in a report.  To do this I created a really basic search form that consisted of just one unbound Combo Box.


The ROW SOURCE for the Combo Box is a table containing all of the tag names used in the database.  The idea is that the user selects a tag from the drop down list, thereby triggering a block of VBA code in order to open the report filtered by the selected tag name.  The screen shot below shows the report filtered by the tag name "ADO.Net":
The underlying table structure for this report is based on a query with
three tables from a many to many relationship.  There is a table for the Entries, and a
separate table for Tags.  There is also a junction table to store each instance of
a tag used in any particular Entry.  As such a journal entry can be related to
many tags records, and any tag record can be related to many Entries.
So how does this work?  When the user selects a tag name from the drop down list, Access fires the Combo Box AFTER UPDATE event.  This in turn executes the followingVBA code that I wrote for this event:

Private Sub comTag_AfterUpdate()

    Dim varSQLWhere As String
    varSQLWhere = "tagId = '" & Me!comTag & "'"
    DoCmd.Close acForm, Me.Name
    DoCmd.OpenReport "rptTagSearch", acViewReport, , varSQLWhere

End Sub
NB for sake of clarity, I have removed all code related to error handling. 

The code begins by defining a string type variable called varSQLWhere - this is going to contain the code for an SQL WHERE clause (minus the WHERE keyword).  Next I set the value of this variable to "tagId = '" & Me!comTag & "'".  TagId is the name of the primary key of the table containing all of the tag names.  In fact, tblTags only contains this one field.  Me!comTag is a reference to the name of the Combo box used on the search form.  Note the manner in which it has been concatenated into the string variable. Due to fact that the value contained in the combo box is itself a string, I have had to build two single quotation makes into the varSQLWhere string.  So for example, if the user had selected the tag name 'Visual Studio' in the Combo Box, the contents of the string variable would be "tagId = 'Visual Studio'" .

The next line of code closes the search form so it does not get in the way when the form opens.

The penultimate line of code is the DoCmd.OpenReport method.  This not only opens our report, but also passes our varSQLWhere variable as one of the method's parameters (the WhereCondition). When this is passed, only records matching our WhereCondition are displayed in the report results.  As such, our report effectively filters our report results by the tag name selected by the user in the search form combo box.

It's not too difficult to apply this type of solution to the application that Marwa is building. The only real difference is that her Database search form consists of three combo boxes.  This means that she would also need to use a  Command Button ONCLICK event to start the search rather than relying on one of the Combo Box AfterUpdate Events.  Then she would need to construct the varSQLWhere variable from all three combo box values.  This would look something like:

varSQLWhere = "fld1 = '" & Me!Combo1 & "' AND fld2 = '" & Me!Combo2 & "' AND fld3 = '" & Me!Combo3 & "'"

So its slightly more complicated, but the same principles apply.

Thursday, 1 December 2011

Adding a Group and Sort to an Access Report

Adding a Group and Sort to an Access Report has the potential to make our data much easier to read.  This is because our information may appear in a clear and more logical format. Take a list of Contacts for example.  We may have a number of contacts working for the same organisation: wouldn't it be convenient for our contact list to be grouped by organisation? Then, depending on how many contacts we have within each organization, it may also make sense to sort each organizations' contact's into alphabetical order.

So instead of having a list like this:

Figure 1: Contact list without Group or Sort.


We have a list like this:

Figure 2: Contact list grouped by Company and sorted by surname and first name.

Both contain exactly the same data, but the list in figure 2 has been grouped by company and sorted by surname and first name (within each group).  You can download these reports by clicking this link: Group and Sort Sample Database.

Lets take a look at how these reports were created.

I began by creating the report from figure 1. I then opened it in DESIGN VIEW and added the Group and Sorts before re-aligning the columns.  Here are the step by step instructions:

Stage One - Create a Basic Report
  1. Highlight the Contacts Table in the NAVIGATION PANE.  The table in the sample database is called tblContacts, and it is the RECORD SOURCE for both Reports.
  2. Click the REPORT icon (located in the REPORTS group of the CREATE ribbon).  This is the quickest way to create a report based on a particular record source.
  3. When the report opens in LAYOUT VIEW, click this symbol:   (it should be located at the top left corner of the ID column).  This highlights all the cells which are currently joined together. 
  4. Then click the REMOVE icon to separate them.  This icon is located in the CONTROL LAYOUT group of the ARRANGE ribbon.  It will now be possible to move individual text boxes and labels independently when we go to DESIGN VIEW.  However, before we do that, we shall first add the Group and Sorts.

Stage Two - Adding the Group and Sorts

  1. Select the HOME ribbon, and then pick DESIGN VIEW from the VIEWS group.
  2. Make sure the GROUP, SORT AND TOTAL icon is highlighted (it is located in the GROUPING AND TOTALS group of the DESIGN ribbon).  You should see the GROUP, SORT AND TOTALS pane open below the DESIGN GRID.
  3. Click ADD A GROUP from the GROUP, SORT AND TOTALS pane (see figure 3 below).
  4. Then select the Company field from the list which appears.  This creates a Company Header (see figure 4 below).
  5. Highlight the Company text box and make sure no other controls are highlighted.
  6. Cut and past the Company text box so that it is positioned close to the left margin within the Company Header.
  7. Reposition the labels and text boxes so that they are aligned in a neat logical fashion (see figure 4 below).
  8. Next click ADD A SORT in the GROUP, SORT AND TOTALS pane.  
  9. Then select Surname from the list.  Notice how a new level has been created below the Company Group.  This is because we want Access to apply the group first and then sort the surnames within the group.
  10. Click ADD A SORT again.
  11. Then select Firstname from the list. This creates another sort, but this time on Firstname.  Notice how this sort is on a level below the first sort.  This is because we want Access to begin by sorting the Surnames, and then if there are duplicates, to sort on FirstName.  This follows the general convention of placing the whole name in alphabetical order.
Figure 3: The Group, Sort and Total pane.

Figure 4: Report Design View showing a Group Header for the Company field.

You can now open the report in REPORT VIEW to see the grouped and sorted results.

Friday, 28 October 2011

Using Conditional Formatting on an Exam Results Report


Conditional Formatting may be applied to Text Box and Combo Box controls on Access Forms and Reports.   It allows us to format the data contained in a particular Text or Combo Box, according to value of that same data.  For example we can create Conditional Formatting for a text box to display a currency value, which when less than 0, will display that value in a red font, instead of the normal black.

Moreover, as well as formatting the Text or Combo Box according to the value contained in that same control, we can also format the Text or Combo box according to the value contained in another field of the same record.  So, for example, we can display a Text Box containing a CompanyName in bold font if the value of its AnnualTurnover field is greater than or equal to, say,  £100,000.  The great thing is, the data contained in the AnnualTurnover field does not necessarily have to be displayed on the form or report, as long as it is stored in the form or reports underlying Record Source.  In order to do this, we would enter an expression for the condition.

So let's take a look at how we go about applying Conditional Formatting using the example of a Student Exam Results Report.  The report applies conditional formatting based on the students exam result.  Students records with a result above 74 % are displayed in green, and those below 40 %, in red. The formatting for those in between is set to blue by default. To enhance clarity, I have also applied a sort on the Results field, thereby ordering the records from highest result to lowest. If you wish, you can download the complete solution by clicking the link below:

Student Exam Results

Our example database contains a table, tblExamResults, and report, rptExamResults- the table being the Record Source for the report.  Our table contains a list of student names and their corresponding exam results:

Figure 1: tblExamResults - The Record Source for our Report.
The rptExamResults report is based on this table.  I created it by clicking the REPORT icon (located in the REPORTS group of the CREATE ribbon) whilst tblExamResults was highlighted in the NAVIGATION PANE.  I then just needed to tidy it up in DESIGN VIEW, and add the Conditional Formatting (on each text box on the report) in addition to a SORT on the Results field.  This is the finished result:


Applying Conditional Formatting.

To begin with, lets look at how we apply Conditional Formatting to the Result field of rptExamResults.
  1. Open the report in DESIGN VIEW
  2. Right click the Result Text Box.
  3. Click CONDITIONAL FORMATTING from the drop down menu.
  4. When the CONDITIONAL FORMATTING dialog form opens, set the conditions as described in the next stage of the process below.
Figure 2: The Conditional Formatting dialog form.  It is possible to have a maximum of
three different conditions plus the default formatting.  
Setting Conditions based on FIELD VALUE IS

The next stage is to set the actual conditions for the Result field of the report (see Figure 2 above). NB: when FIELD VALUE IS is selected, it refers to the value contained in the text box being formatted:
  1. First set the DEFAULT FORMATTING section so it displays a BLUE FONT.  Do this by selecting BLUE from the FONT/FORE COLOR icon
  2. Next set CONDITION 1 so that a BOLD GREEN FONT displays when the  FIELD VALUE IS GREATER THAN 74.  If necessary click the drop down list to select FIELD VALUE IS, and then do the same in the next combo box along to select GREATER THAN.  Then just enter the value 74 in the third box along, and select the BOLD and RED icons.  You should see a preview in the box below when done.
  3. Click the ADD >> button to show CONDITION 2.
  4. Repeat the process of stage 2 so that a BOLD RED FONT displays when FIELD VALUE IS LESS THAN 40.
  5. Click OK to close.
Setting Conditions based on EXPRESSION IS

The next stage is to set the conditions for the StudentId field.  Since we are not basing the condition on the value contained in the StudentId field itself, we need to construct an expression which refers to the value contained in the Results field. As such, we shall be selecting EXPRESSION IS from the appropriate drop down lists, rather than FIELD VALUE IS.
  1. Again, set the DEFAULT FORMATTING section so it displays a BLUE FONT.  Do this by selecting BLUE from the FONT/FORE COLOR icon
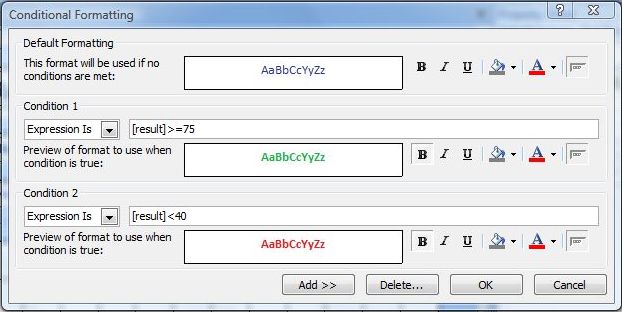
  2. Next set CONDITION 1 so that a BOLD GREEN FONT displays when the EXPRESSION IS [Results]>=75.  Do this by clicking the drop down list to select EXPRESSION IS, and then enter the expression in the elongated box (see Figure 3 below).  Then select the BOLD and RED icons as before.  
  3. Click the ADD >> button to show CONDITION 2.
  4. Repeat the process of stage 2 so that a BOLD RED FONT displays when EXPRESSION IS [Results]<40
  5. Click OK to close.

Figure 3: Condition based on EXPRESSION IS.  Note the elongated box where the expression is entered.  This appears when EXPRESSION IS is selected from the drop down list.
Finish the report by repeating this last stage for the FirstName and Surname fields using the EXPRESSION IS selection when creating the conditions.


Friday, 30 September 2011

Filtering Report Results Using the Filter Property

In this tip we are going to filter the results of a Report to display records with order amounts above a given value.  In so doing we are going to pay special attention to two Report properties: these are FILTER, and FILTER ON LOAD.

Our solution works when the user opens a Dialog Form containing a text box and command button.  The user enters an amount value in the text box, and clicks the command button.  The command button then runs a small amount of VBA code to open the report.  As the report loads, it applies a filter defined in the Report's Filter Property to produce the desired result.

Figure 1: Dialog Form to collect the Amount Parameter.

So how does this work?

When the Report opens, Access checks the report's FILTER ON LOAD property (which we have set to YES). When it detects the property is set to YES, this tells Access to apply the report's Filter (which we have entered into the report's FILTER property). Our filter then references the users parameter value from the Dialog Form text box, and filters all records with Order Amounts greater than or equal to that value.

You can download the completed solution from here: Filter Property Tip Database. You may also want to work your way through the instructions below.

The Table

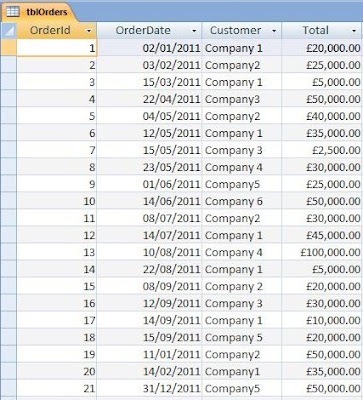
The solution contains a Table (tblOrders), a Dialog Form (frmParameter) and a Report (rptOrders).  In the screenshot, below you will see the data we shall be working with in tblOrders:

Figure 2: tblOrders.
As you can see the table is made up of four fields: OrderId (AutoNumber), OrderDate (Date/Time), Customer (Text), and Total (Currency).  

The Dialog Form

We then create the dialog form shown in Figure 1 above (there is more information about Dialog Forms in my last post).  I have referred to the textbox as txtAmount, the control button as cmdOpenReport, and the form itself as frmParameter.

As I have already mentioned, the command button runs a small amount of VBA Code when clicked by the user.  To add this code:
  1. Select the command button on the form design grid, and click the PROPERTY SHEET icon (located in the TOOLS group of the DESIGN ribbon).  
  2. When the PROPERTY SHEET opens, click the EVENT TAB.  
  3. Then select the ON CLICK event by clicking into that particular cell of the grid.  
  4. A three dot  symbol appears at the right edge of the cell. Click it and select CODE BUILDER from the CHOOSE BUILDER dialog box which has opened.  
  5. Then click the OK button and the VBA editor opens.
Figure 3: The On Click Event on
the PROPERTIES SHEET.
You can can copy the code below and paste it onto the editor.  The top and bottom lines that begin Private Sub... and End Sub respectively should have appeared already, so you just need to copy the middle section in between:


Private Sub cmdOpenReport_Click()

On Error GoTo MyError


    DoCmd.OpenReport "rptOrdersFiltered", acViewReport
    DoCmd.Close acForm, Me.Name

Leave:

    Exit Sub
    
MyError:

    MsgBox "Error " &  Err.Number &  ": " &  Error$
    Resume Leave

End Sub

The two important lines in this section of code begin with DoCmd (meaning do command).  The first of these is the command to open the form in Report View.  The second closes the Dialog form once the report has opened.  NB it is very important the report opens before  the Dialog Form closes, because it needs to reference the value contained in the Dialog Form's Textbox as the it loads.  

The Report

The quickest way to create the Report is to base it on our table.

  1. Select tblOrders in the Navigation Pane.  It will highlight in orange.
  2. Then select  the CREATE ribbon , and click the REPORT icon (located in the REPORTS GROUP). 
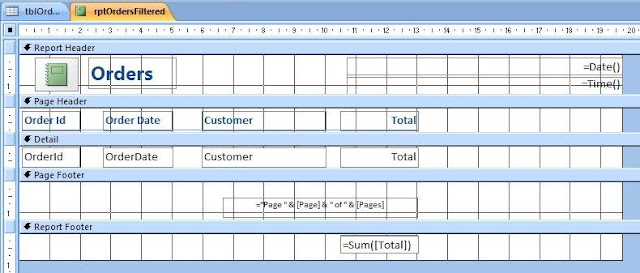
This creates a basic report which we can then then modify in DESIGN VIEW as required. 


Figure 4: Report Design.
Setting the Filter Properties

Next we turn our attention to setting the Report's Filter Properties accessed via its Property sheet.

  1. Click the Square Box in the top right hand corner of the Report Design Grid.  This ensures we are going to be working the properties of the actual Form (rather than one of its controls).
  2. Click on the PROPERTY SHEET icon (located in the TOOLS group of the DESIGN ribbon) whilst the Report is open in Design View.
  3. Click the DATA TAB of the pane.
  4. Make sure the SELECTION TYPE is set to REPORT.  This should be the case if you carried out step 1 successfully.  Otherwise just change the selection to Form in the drop down list.
  5. Enter the following into the FILTER property cell: Total >= forms![frmParameter]![txtAmount] .  This has the effect of filtering out report records where the amount value in the Total field is greater or equal to that entered by the user in the Dialog Form's textbox.
  6. Then set the FILTER ON LOAD PROPERTY to YES.  This ensures the filter is applied when the forms loads.
  7. Save the Report as rptOrdersFiltered.
  8. Close the Report
Figure 5: The Form's Filter Properties.  Note the reference to the textbox
on our Dialog Form in the FILTER property cell.
The solution should now be ready to run.  Just click the frmParameter form in the Navigation Pane to begin.  The screenshot below shows what the report results look like when £50,000 is entered by the user as the amount parameter: 

Figure 6: Report Results filtered for amounts greater than or equal to £50,000.